My Homelab Current Setup
My Homelab Current Setup
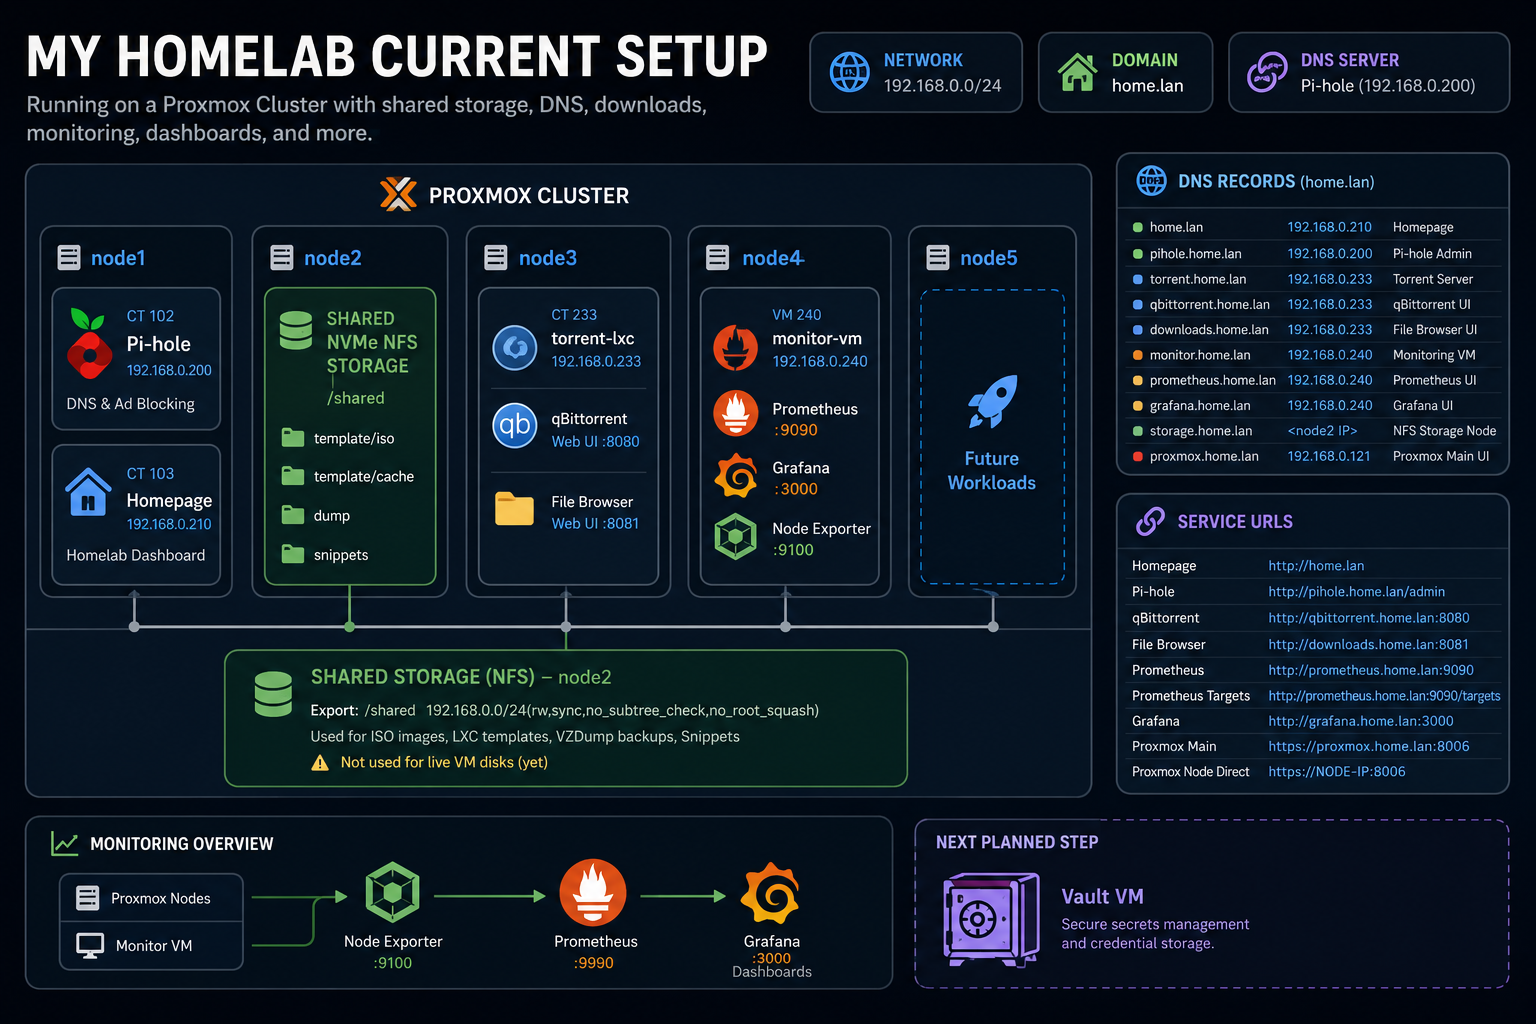
This is the current state of my homelab after the latest build session.
The goal of this phase was not to make everything perfect. The goal was to build a real working foundation: compute, shared storage, local DNS, downloads, monitoring, dashboards, and a simple homepage to access everything from one place.
And now the base is alive.
What we have built so far
The homelab now has these core services running:
- Proxmox cluster for compute
- Shared NFS storage from
node2 - Pi-hole for local DNS and ad blocking
- Homepage dashboard for quick access to services
- Torrent/download LXC on
node3 - qBittorrent Web UI for downloads
- File Browser for browsing completed downloads
- Monitoring VM on
node4 - Prometheus for metrics collection
- Grafana for dashboards
- Node Exporter on Proxmox nodes and the monitoring VM
- Local DNS domain using
home.lan
Architecture overview
Proxmox Cluster
│
├── node1
│   ├── CT 102: Pi-hole
│   └── CT 103: Homepage
│
├── node2
│   └── Shared NVMe NFS Storage
│       └── /shared
│           ├── template/iso
│           ├── template/cache
│           ├── dump
│           └── snippets
│
├── node3
│   └── CT 233: torrent-lxc
│       ├── qBittorrent Web UI
│       └── File Browser UI
│
├── node4
│   └── VM 240: monitor-vm
│       ├── Prometheus
│       ├── Grafana
│       └── Node Exporter
│
├── node5
│   └── Future workloads
│
└── Proxmox Nodes
    └── Node Exporter on each node
Network plan
The homelab is currently using the LAN subnet:
192.168.0.0/24
The primary local domain is:
home.lan
Pi-hole is used as the local DNS server. The idea is simple: instead of remembering every IP address and port, services get readable local names like grafana.home.lan, pihole.home.lan, and downloads.home.lan.
Known service inventory
| Service | IP / Host | ID | Purpose |
|---|---|---|---|
| Pi-hole | 192.168.0.200 | CT 102 | DNS and ad blocking |
| Homepage | 192.168.0.210 | CT 103 | Main homelab dashboard |
| Torrent LXC | 192.168.0.233 | CT 233 | qBittorrent and File Browser |
| Monitor VM | 192.168.0.240 | VM 240 | Prometheus, Grafana, Node Exporter |
| Node2 Storage | node2 IP | Host | Shared NFS storage |
| Proxmox main record | 192.168.0.121 | Host | proxmox.home.lan currently points here |
Current DNS records
| Domain | IP | Purpose |
|---|---|---|
home.lan | 192.168.0.210 | Homepage dashboard |
pihole.home.lan | 192.168.0.200 | Pi-hole admin |
torrent.home.lan | 192.168.0.233 | Torrent server base host |
qbittorrent.home.lan | 192.168.0.233 | qBittorrent Web UI |
downloads.home.lan | 192.168.0.233 | File Browser downloads UI |
monitor.home.lan | 192.168.0.240 | Monitoring VM |
prometheus.home.lan | 192.168.0.240 | Prometheus UI |
grafana.home.lan | 192.168.0.240 | Grafana UI |
storage.home.lan | node2 IP | Shared NFS storage node |
proxmox.home.lan | 192.168.0.121 | Main Proxmox UI record |
Current service URLs
Some services still use ports directly. Later, a reverse proxy like Caddy or Nginx Proxy Manager can clean this up.
| Service | URL |
|---|---|
| Homepage | http://home.lan |
| Pi-hole | http://pihole.home.lan/admin |
| qBittorrent | http://qbittorrent.home.lan:8080 |
| File Browser | http://downloads.home.lan:8081 |
| Prometheus | http://prometheus.home.lan:9090 |
| Prometheus targets | http://prometheus.home.lan:9090/targets |
| Grafana | http://grafana.home.lan:3000 |
| Proxmox main | https://proxmox.home.lan:8006 |
| Proxmox node direct | https://NODE-IP:8006 |
Shared storage: node2 NFS
node2 is currently acting as the shared storage server for cluster assets.
This storage is for:
- ISO images
- LXC templates
- VZDump backups
- Snippets
It is not currently being used for live VM disks.
Storage mount
The NVMe storage on node2 is mounted at:
/shared
Expected folder structure:
/shared
├── template
│   ├── iso
│   └── cache
├── dump
└── snippets
NFS export
Current NFS export:
/shared 192.168.0.0/24(rw,sync,no_subtree_check,no_root_squash)
Check exports:
exportfs -v
Expected output should include something like:
/shared 192.168.0.0/24(...,rw,...,no_root_squash,...)
Proxmox storage entry
In the Proxmox GUI:
Datacenter → Storage → shared-nfs
Enabled content types:
- ISO image
- Container template
- VZDump backup file
- Snippets
Important rule for now:
Do not use shared-nfs for live VM disks yet.
Torrent/download server: node3 torrent-lxc
The torrent server is a dedicated LXC container for Linux ISOs and other legal downloads.
Container details
| Setting | Value |
|---|---|
| CT ID | 233 |
| Hostname | torrent-lxc |
| IP | 192.168.0.233/24 |
| Gateway | 192.168.0.1 |
| DNS | 192.168.0.200 |
| Storage | node3 NVMe / nvme3 |
| Disk | ~400 GB |
| CPU | 2 cores |
| RAM | 2 GB |
qBittorrent
qBittorrent Web UI:
http://192.168.0.233:8080
http://qbittorrent.home.lan:8080
Service check:
systemctl status qbittorrent-nox
Download folders:
/downloads/incomplete
/downloads/complete
File Browser
File Browser UI:
http://192.168.0.233:8081
http://downloads.home.lan:8081
File Browser root:
/downloads/complete
Service check:
systemctl status filebrowser
Change File Browser root:
systemctl stop filebrowser
filebrowser config set -d /etc/filebrowser/filebrowser.db -r /downloads/complete
systemctl start filebrowser
Copy completed ISO files to shared Proxmox storage
From inside torrent-lxc:
rsync -avh --progress /downloads/complete/*.iso root@NODE2-IP:/shared/template/iso/
After copying, the ISO should appear in Proxmox:
Datacenter → shared-nfs → ISO Images
Monitoring VM: node4 monitor-vm
The monitoring VM is the central observability box.
It currently runs:
- Prometheus
- Grafana
- Node Exporter
VM details
| Setting | Value |
|---|---|
| VM ID | 240 |
| Name | monitor-vm |
| Node | node4 |
| IP | 192.168.0.240/24 |
| Gateway | 192.168.0.1 |
| DNS | 192.168.0.200 |
| Search domain | home.lan |
| CPU | 2 cores |
| RAM | 4 GB |
| Disk | 60 GB |
| OS | Ubuntu Server |
Firewall ports
The monitoring VM allows:
22/tcp    SSH
9090/tcp  Prometheus
9100/tcp  Node Exporter
3000/tcp  Grafana
Check UFW:
sudo ufw status
Prometheus
Prometheus is used for metrics collection.
Access
http://192.168.0.240:9090
http://prometheus.home.lan:9090
Service commands
Check service:
sudo systemctl status prometheus
Health check:
curl http://localhost:9090/-/healthy
Expected output:
Prometheus Server is Healthy.
Config path:
/etc/prometheus/prometheus.yml
Current scrape jobs
Prometheus currently scrapes:
- Prometheus itself
monitor-vmNode Exporter- Proxmox node exporters
Example config shape:
global:
  scrape_interval: 15s
  evaluation_interval: 15s

scrape_configs:
  - job_name: "prometheus"
    static_configs:
      - targets: ["localhost:9090"]

  - job_name: "monitor-vm"
    static_configs:
      - targets: ["localhost:9100"]

  - job_name: "proxmox-nodes"
    static_configs:
      - targets:
          - "NODE1-IP:9100"
          - "NODE2-IP:9100"
          - "NODE3-IP:9100"
          - "NODE4-IP:9100"
          - "NODE5-IP:9100"
        labels:
          group: "proxmox"
Validate config before restarting:
sudo promtool check config /etc/prometheus/prometheus.yml
Restart Prometheus:
sudo systemctl restart prometheus
Open targets page:
http://prometheus.home.lan:9090/targets
Node Exporter
Node Exporter exposes system metrics like:
- CPU usage
- RAM usage
- Disk usage
- Network traffic
- Load average
- Uptime
It is installed on:
monitor-vm- Proxmox
node1 - Proxmox
node2 - Proxmox
node3 - Proxmox
node4 - Proxmox
node5 - Additional Proxmox endpoint
192.168.0.125, visible in Prometheus targets
Each machine exposes metrics at:
http://NODE-IP:9100/metrics
Test locally on each node:
curl http://localhost:9100/metrics | head
Check service:
systemctl status node_exporter
Grafana
Grafana is used for dashboards and visualization.
Access
http://192.168.0.240:3000
http://grafana.home.lan:3000
Service
sudo systemctl status grafana-server
Data source
Grafana uses Prometheus as the data source.
Prometheus URL inside Grafana:
http://localhost:9090
Dashboard
Imported dashboard:
Node Exporter Full
Dashboard ID: 1860
This dashboard shows:
- CPU usage
- RAM usage
- Disk usage
- Network traffic
- Load average
- Uptime
- Per-node metrics
Homepage dashboard
Homepage runs as CT 103 on node1.
Current DNS record:
home.lan → 192.168.0.210
Access URL:
http://home.lan
Config path:
/opt/homepage/config/services.yaml
Project folder:
/opt/homepage
Restart Homepage:
cd /opt/homepage
docker compose restart
Current Homepage services
- Downloads:
    - qBittorrent:
        href: http://qbittorrent.home.lan:8080
        description: Torrent download manager
        icon: qbittorrent.png
        siteMonitor: http://qbittorrent.home.lan:8080

    - File Browser:
        href: http://downloads.home.lan:8081
        description: Browse completed downloads
        icon: filebrowser.png
        siteMonitor: http://downloads.home.lan:8081

- Monitoring:
    - Grafana:
        href: http://grafana.home.lan:3000
        description: Monitoring dashboards
        icon: grafana.png
        siteMonitor: http://grafana.home.lan:3000

    - Prometheus:
        href: http://prometheus.home.lan:9090
        description: Metrics and time-series database
        icon: prometheus.png
        siteMonitor: http://prometheus.home.lan:9090

- Storage:
    - Shared NFS Storage:
        href: http://storage.home.lan
        description: Node2 shared NVMe storage for ISOs, templates, backups
        icon: proxmox.png
Note: storage.home.lan may not show as online unless there is a web service running on that host. Right now it mostly acts as a DNS/link reference for the storage node.
Current Proxmox inventory
Datacenter: myworld
│
├── node1
│   ├── CT 102: pihole
│   ├── CT 103: homepage
│   ├── VM 100: test VM, ignored
│   ├── VM 101: test VM, ignored
│   ├── local
│   ├── local-lvm
│   └── shared-nfs
│
├── node2
│   ├── local
│   ├── local-lvm
│   └── shared-nfs
│
├── node3
│   ├── CT 233: torrent-lxc
│   ├── local
│   ├── local-lvm
│   ├── nvme3
│   └── shared-nfs
│
├── node4
│   ├── VM 240: monitor-vm
│   ├── local
│   ├── local-lvm
│   ├── nvme4
│   └── shared-nfs
│
└── node5
    ├── local
    ├── local-lvm
    └── shared-nfs
VM 100 and VM 101 are test VMs and should be ignored in the main documentation unless they become real services later.
Validation checklist
Shared storage
On node2:
df -h | grep /shared
exportfs -v
In Proxmox:
Datacenter → Storage → shared-nfs
Confirm that ISO images, container templates, backups, and snippets are enabled.
Torrent LXC
Inside torrent-lxc:
systemctl status qbittorrent-nox
systemctl status filebrowser
Browser checks:
http://qbittorrent.home.lan:8080
http://downloads.home.lan:8081
Monitoring VM
Inside monitor-vm:
sudo systemctl status prometheus
sudo systemctl status grafana-server
sudo systemctl status node_exporter
Browser checks:
http://prometheus.home.lan:9090/targets
http://grafana.home.lan:3000
Proxmox node exporters
On each Proxmox node:
systemctl status node_exporter
curl http://localhost:9100/metrics | head
What this build taught me
The biggest lesson from this build is that every homelab service follows the same pattern:
Storage → Network → User/Permissions → Service/Systemd → Firewall/DNS → Monitoring → Homepage
This pattern showed up again and again:
- NFS storage needed mount points, exports, permissions, and Proxmox storage mapping.
- qBittorrent needed storage folders, service setup, ports, DNS, and Homepage entry.
- File Browser needed a root folder, systemd service, port, DNS, and Homepage entry.
- Prometheus needed scrape configs, service validation, firewall rules, and target checks.
- Grafana needed Prometheus as a data source, dashboards, and local DNS access.
- Node Exporter needed service installation on every node and Prometheus scraping.
That reusable mental model is now the operating system for future homelab work.
Next planned build: Personal Vault VM
The next planned service group is:
personal-vault-vm
Planned IP:
192.168.0.250
Planned services:
- Tailscale subnet router
- RustDesk server
- Possibly Nginx Proxy Manager or Caddy
Planned DNS records:
| Domain | IP |
|---|---|
vault.home.lan | 192.168.0.250 |
tailscale.home.lan | 192.168.0.250 |
rustdesk.home.lan | 192.168.0.250 |
Future improvements
Potential next improvements:
- Add Proxmox API exporter for VM/container-level metrics
- Add alerting in Grafana or Prometheus Alertmanager
- Add Nginx Proxy Manager or Caddy for clean no-port URLs
- Add Tailscale for secure remote access
- Add RustDesk server for remote desktop relay
- Add backups for configs and VMs
- Add a documentation repo for the homelab setup
- Add Ansible scripts for repeatable installs
- Consider Ceph later for true distributed storage across node NVMe drives
Current status
This homelab now has a real foundation:
Compute:      Proxmox cluster
Storage:      node2 shared NFS
DNS:          Pi-hole + home.lan
Dashboard:    Homepage
Downloads:    qBittorrent + File Browser
Monitoring:   Prometheus + Grafana + Node Exporter
Next step:    Personal Vault VM
The important part is that it is no longer just a group of machines. It is becoming a small, organized platform.